.png?sfvrsn=efb43a8c_0 "FLOIR Linkedin Header")
.png?sfvrsn=b3d86eee_1)
The Florida Office of Insurance Regulation (OIR) oversees one of the most complex property insurance markets in the world and serves as a national leader in identifying market trends and taking bold action to promote a stable and competitive insurance market for consumers.
OIR is a national leader in identifying market trends and taking bold action because OIR collects more data about its insurance market than any other state or regulatory entity. OIR tracks and collects data from different sources to monitor affordability and availability in the property insurance market. A full list of OIR's required data reporting for property and casualty insurers is available here.
This page provides comprehensive data on the homeowners insurance market in Florida and includes data points such as market shares, rates and premiums, company financial information, and reinsurance coverage. This page is intended to serve as a resource for consumers and other stakeholders impacted by Florida's property insurance market.

Property Insurance Market Highlights
7.58M
Residential Insurance Policies in Force
$3,731
Admitted Market Avg. Homeowner's Premium
1,263,749
Policies Approved for Citizens Takeout in 2024
0.8%
30-Day Average Request for Homeowners' Rates
1.3%
180-Day Average Request for Homeowners' Rates
Data as of November 1, 2024.
Property Insurance Market Data
Residential Policies and Direct Written Premium
OIR oversees one of the largest insurance markets in the world. One of the way OIR monitors data trends in the property insurance market is by tracking the total number of residential policies, the total direct written premium, and the total insured value within the market.
The table below provides policy totals for all carriers in Florida writing residential policies, including Citizens Property Insurance Corporation, starting with Q1 2022 (January 1 - March 31, 2022) to Q2 2024 (April 1 - June 30, 2024). This data can also be found in OIR's Residential Market Share Reports available here.
| Quarter | Total Residential Policies | Total Direct Written Premium | Total Insured Value |
| Q2 2024 | 7,581,254 | $22,416,767,160 | $3,797,370,622,521 |
| Q1 2024 | 7,556,538 | $21,831,517,776 | $3,766,431,139,518 |
| Q4 2023 | 7,544,976 | $21,328,035,654 | $3,730,508,196,808 |
| Q3 2023 | 7,620,276 | $20,871,991,776 | $3,687,621,578,388 |
| Q2 2023 | 7,500,153 | $19,898,253,248 | $3,569,667,304,756 |
| Q1 2023 | 7,497,798 | $18,554,038,845 | $3,397,042,074,911 |
| Q4 2022 | 7,272,166 | $16,874,221,107 | $3,225,743,174,088 |
| Q3 2022 | 7,332,131 | $16,470,779,352 | $3,191,568,487,094 |
| Q2 2022 | 7,295,832 | $15,893,178,599 | $3,094,143,047,059 |
| Q1 2022 | 7,316,364 | $15,379,548,433 | $2,999,228,884,237 |
Data as of June 30, 2024. Data from Quarterly Supplemental Reporting (QUASR).
Admitted Property Market vs. Non-Admitted Property Market
OIR tracks the number of personal and commercial residential property policies within the market through QUASRng. The admitted market is entities regulated through OIR. The non-admitted market is entities such as Citizens Property Insurance Corporation and Surplus Lines carriers. All admitted and non-admitted property writers are required to report data to OIR on a consistent basis. The table and chart below show the percentage of Florida's admitted property insurance market versus the non-admitted property insurance market.
Admitted Property Market vs. Non-Admitted Property Market - Table
| Year | Admitted Property Market Policies in Force | Non-Admitted Property Market Policies in Force - Citizens | Non-Admitted Property Market Policies in Force - Surplus Lines | Total Policies in Force |
| 2024 - Q2 | 6.37M | 1.21M | 0.25M | 7.83M |
| 2024 - Q1 | 6.39M | 1.16M | 0.26M | 7.81M |
| 2023 | 6.32M | 1.22M | 0.26M | 7.81M |
| 2022 | 6.13M | 1.14M | 0.31M | 7.58M |
| 2021 | 6.39M | 0.76M | 0.32M | 7.47M |
| 2020 | 6.57M | 0.54M | 0.33M | 7.44M |
| 2019 | 6.43M | 0.44M | 0.34M | 7.21M |
| 2018 | 6.32M | 0.42M | 0.31M | 7.05M |
| 2017 | 6.22M | 0.43M | 0.27M | 6.92M |
| 2016 | 6.04M | 0.45M | 0.22M | 6.71M |
| 2015 | 5.87M | 0.49M | 0.19M | 6.55M |
| 2014 | 5.54M | 0.64M | 0.15M | 6.33M |
| 2013 | 5.11M | 1.00M | 0.13M | 6.24M |
| 2012 | 4.80M | 1.29M | 0.11M | 6.2M |
| 2011 | 4.67M | 1.44M | 0.10M | 6.21M |
| 2010 | 4.89M | 1.25M | 0.09M | 6.23M |
| 2009 | 5.19M | 1.00M | 0.09M | 6.28M |
| 2008 | 5.22M | 1.05M | - | 6.27M |
| 2007 | 4.91M | 1.27M | - | 6.18M |
| 2006 | 5.46M | 0.92M | - | 6.38M |
Admitted Property Market vs. Non-Admitted Property Market - Chart
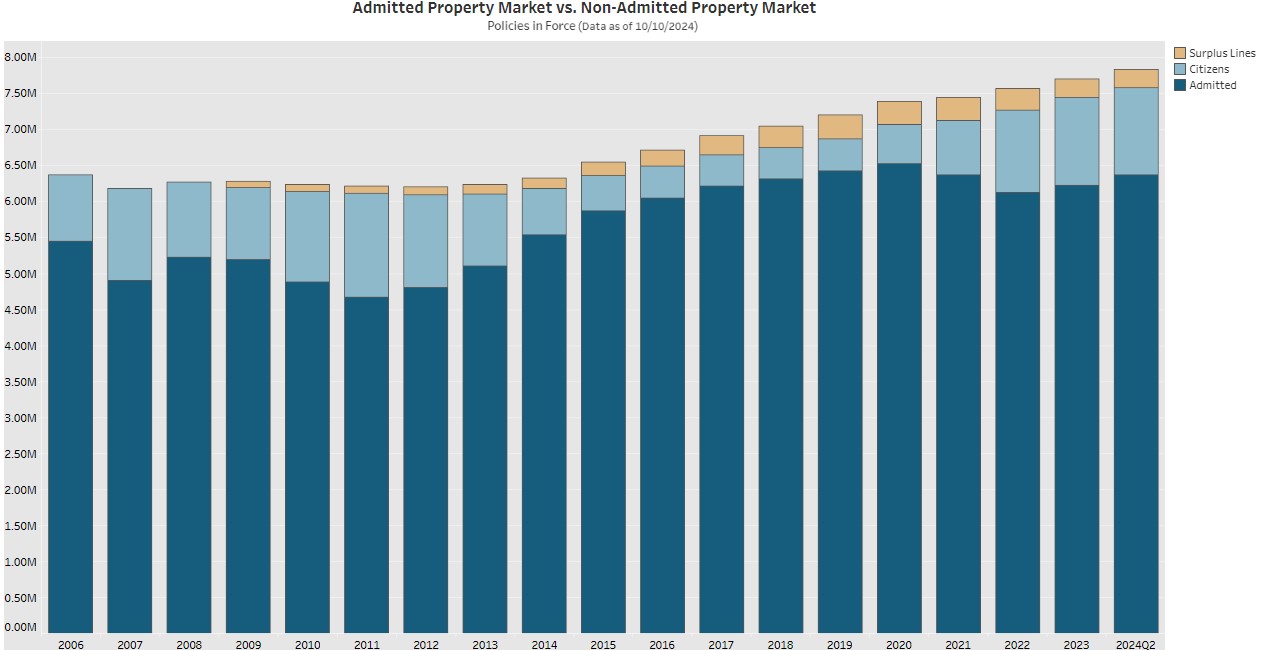 |
Data as of October 10, 2024. Data is from Quarterly Supplemental Reporting (QUASR) and Florida Surplus Lines Service Office (FSLSO). Data does not include State Farm for years 2014 - 2018 and American Coastal Insurance Company, United Property & Casualty Insurance Company, and Family Security Insurance Company for years 2017 and 2018 due to trade secret declarations.
Residential Market Share Reports
OIR publishes residential market share reports, which provides information about the amount of direct written premium and total exposure by a company within a market. These reports are updated quarterly and are available on OIR's website here.
The table below provides information about statewide totals of property and casualty insurers in Florida as of Q3 2024 (July 1 - September 30, 2024).
| Total Number of Policies in Force | Number of Commercial Residential Policies in Force | Number of Personal Residential Policies in Force | Total Direct Written Premium Written for Policies in Force | Direct Premium Written for Commercial Residential Policies in Force | Direct Premium Written for Personal Residential Policies in Force |
| 7,545,424 | 35,681 | 7,509,743 | $22,713,583,426 | $2,195,916,330 | $20,517,667,096 |
Data as of September 30, 2024. Data is from Quarterly Supplemental Reporting (QUASR).
The table below provides information about the top 25 largest property and casualty insurers in Florida as of Q3 2024 (July 1 - September 30, 2024).
| Company Name | Total Number of Policies in Force | Number of Commercial Residential Policies in Force | Number of Personal Residential Policies in Force | Total Direct Premium Written for Policies in Force | Direct Premium Written for Commercial Residential Policies in Force | Direct Premium Written for Personal Residential Policies in Force |
| Citizens Property Insurance Corporation | 1,256,791 | 7,145 | 1,249,646 | $4,384,912,453 | $785,735,454 | $3,599,176,999 |
| State Farm Florida Insurance Company | 642,609 | 14,122 | 628,487 | $1,271,796,202 | $21,428,978 | $1,250,367,224 |
| Universal Property & Casualty Insurance Company | 560,227 | 0 | 560,227 | $1,594,170,176 | $0 | $1,594,170,176 |
| Tower Hill Insurance Exchange | 374,986 | 0 | 374,986 | $1,107,091,846 | $0 | $1,107,091,846 |
| American Bankers Insurance Company of Florida | 313,947 | 0 | 313,947 | $55,838,495 | $0 | $55,838,495 |
| American Integrity Insurance Company of Florida | 264,382 | 0 | 264,382 | $675,859,355 | $0 | $675,859,355 |
| Slide Insurance Company | 273,281 | 0 | 273,281 | $1,118,415,848 | $0 | $1,118,415,848 |
| First Protective Insurance Company | 248,081 | 971 | 247,110 | $923,650,661 | $102,068,781 | $821,581,881 |
| Castle Key Indemnity Company | 195,123 | 0 | 195,123 | $354,398,030 | $0 | $354,398,030 |
| ASI Preferred Insurance Corp. | 150,787 | 0 | 150,787 | $328,341,738 | $0 | $328,341,738 |
| United States Automobile Association | 156,674 | 0 | 156,674 | $432,996,057 | $0 | $432,996,057 |
| Florida Peninsula Insurance Company | 146,874 | 0 | 146,874 | $630,026,306 | $0 | $630,026,306 |
| Heritage Property & Casualty Insurance Company | 123,378 | 2,785 | 120,593 | $703,174,853 | $293,248,358 | $409,926,495 |
| Security First Insurance Company | 136,908 | 0 | 136,908 | $442,349,461 | $0 | $442,349,461 |
| Homeowners Choice Property & Casualty Insurance Company, Inc. | 119,694 | 0 | 119,694 | $522,825,848 | $0 | $522,825,848 |
| Edison Insurance Company | 133,144 | 0 | 133,144 | $563,888,243 | $0 | $563,888,243 |
| American Modern Home Insurance Company | 122,225 | 0 | 122,225 | $24,255,901 | $0 | $24,255,901 |
| Southern Oak Insurance Company | 124,447 | 0 | 124,447 | $314,504,503 | $0 | $314,504,503 |
| American Traditions Insurance Company | 118,670 | 0 | 118,670 | $191,019,586 | $0 | $191,019,586 |
| KIN Interinsurance Network | 132,978 | 0 | 132,978 | $393,528,312 | $0 | $393,528,312 |
| Homesite Insurance Company | 108,741 | 0 | 108,741 | $87,660,135 | $0 | $87,660,135 |
| Monarch National Insurance Company | 94,578 | 0 | 94,578 | $385,691,687 | $0 | $385,691,687 |
| American Strategic Insurance Corp. | 85,679 | 0 | 85,679 | $166,478,430 | $0 | $166,478,430 |
| USAA Casualty Insurance Company | 88,295 | 0 | 88,295 | $227,431,589 | $0 | $227,431,589 |
| American Security Insurance Company | 108,125 | 0 | 108,125 | $492,761,554 | $0 | $492,761,554 |
Data as of September 30, 2024. Data is from Quarterly Supplemental Reporting (QUASR).
Rate and Form Filings
OIR provides the general public with access to thousands of insurance company form and rate filings as part of the "Insurance Regulation Filing System (IRFS) Forms & Rates Filing Search" system. IRFS contains relevant filings for both the Life & Health and Property & Casualty lines of business. Users can search, view and/or download publicly available information related to these types of filings from January 5, 2001 to the present.
Please note, under Florida law, insurers have the option to submit filings as "use and file" or "file and use." A "use and file" filing can be implemented immediately. A company making a "use and file" filing is potentially subject to an order by OIR to return to policyholders portions of rates found to be excessive, in accordance with s. 626.0651, F.S.
The IRFS Forms & Rates Filing Search is available here.
Disclaimer: Displayed rate changes may not fully reflect increases and decreases due to claims of trade secret.
Requested vs Approved Rates - Personal Residential Property
(Homeowners Multi-Peril, Mobile Home Multi-Peril, Dwelling Fire)
Florida's property insurance market has experienced challenges over the past several years. Most of the primary cost drivers in the Florida property insurance market, including catastrophic claims, adverse loss reserve development, inflation, and higher reinsurance costs, are notably exacerbated by excessive and costly litigation. In response to challenges in the market, insurers pass these costs to the consumer by increasing premiums to cover losses and expenses, creating affordability challenges for consumers.
In Florida, there are statutory requirements in place to protect consumers regarding rates and all insurers authorized to transact insurance in Florida must meet all requirements of the Florida Insurance Code. As such, OIR enforces all applicable provisions of Florida Statutes when reviewing policy and rate filings. Rates, including rate increases, must be adequate to maintain insurer solvency and pay claims, in accordance with s. 627.062, F.S. OIR carefully reviews proposed rate filings to ensure they comply with all applicable laws and are not excessive, inadequate, or unfairly discriminatory. Please note, If OIR finds a rate filing is inadequate to support company operations, OIR may direct the company to set a higher rate than requested.
The table below displays the average requested rate for Personal Residential Property lines of business and the average rate approved by OIR for Personal Residential Property lines of business from August 2020 - July 2024.
Personal Residential Property lines of business include Homeowners Multi-Peril, Mobile Home Multi-Peril and Dwelling Fire. Please note, rates for individual policies may vary.
Personal Residential Property Average Rates Requested and Approved - Table
| Month of Effective Date | Average Rate Requested | Average Rate Approved |
| August 2020 | 11.83% | 10.43% |
| September 2020 | 8.87% | 8.86% |
| October 2020 | 6.81% | 7.21% |
| November 2020 | 10.88% | 9.95% |
| December 2020 | 7.45% | 7.42% |
| January 2021 | 8.87% | 8.88% |
| February 2021 | 5.76% | 5.67% |
| March 2021 | 7.74% | 7.99% |
| April 2021 | 3.87% | 3.83% |
| May 2021 | 4.63% | 3.98% |
| June 2021 | 10.61% | 11.54% |
| July 2021 | 17.56% | 16.74% |
| August 2021 | 7.62% | 7.58% |
| September 2021 | 8.40% | 8.33% |
| October 2021 | 5.11% | 5.06% |
| November 2021 | 6.51% | 5.67% |
| December 2021 | 7.77% | 6.13% |
| January 2022 | 9.36% | 9.33% |
| February 2022 | 6.77% | 5.80% |
| March 2022 | 6.20% | 6.21% |
| April 2022 | 4.64% | 4.64% |
| May 2022 | 5.21% | 4.77% |
| June 2022 | 12.50% | 12.49% |
| July 2022 | 12.22% | 11.28% |
| August 2022 | 9.63% | 9.65% |
| September 2022 | 11.37% | 8.43% |
| October 2022 | 9.85% | 9.32% |
| November 2022 | 8.33% | 8.20% |
| December 2022 | 14.28% | 11.99% |
| January 2023 | 7.08% | 5.30% |
| February 2023 | 7.98% | 7.98% |
| March 2023 | 3.50% | 2.67% |
| April 2023 | 5.65% | 5.54% |
| May 2023 | 7.89% | 7.772% |
| June 2023 | 11.69% | 11.69% |
| July 2023 | 6.88% | 6.81% |
| August 2023 | 11.32% | 11.31% |
| September 2023 | 3.97% | 3.97% |
| October 2023 | 6.20% | 4.76% |
| November 2023 | 2.84% | 2.84% |
| December 2023 | 9.59% | 9.46% |
| January 2024 | 1.82% | 1.82% |
| February 2024 | 0.98% | 0.98% |
| March 2024 | 1.10% | 1.10% |
| April 2024 | -2.03% | -2.03% |
| May 2024 | 3.50% | 0.52% |
| June 2024 | 3.22% | 3.22% |
| July 2024 | 3.98% | 3.89% |
Data as of July 29, 2024. Data is from rate filings submitted by insurers through the Insurance Regulation Filing System. Data includes Citizens Property Insurance Corporation.
Public Rate Hearings
In Florida, there are statutory requirements in place to protect consumers regarding rates and all insurers authorized to transact insurance in Florida must meet all requirements of the Florida Insurance Code. As such, OIR enforces all applicable provisions of Florida Statutes when reviewing policy and rate filings. Rates, including rate increases, must be adequate to maintain insurer solvency and pay claims, in accordance with s. 627.062, F.S.
OIR carefully reviews proposed rate filings to ensure they comply with all applicable laws and are not excessive, inadequate, or unfairly discriminatory. Additionally, OIR holds rate hearings for rate increases above 15% to receive comments from the public and to hear testimony from companies.
These hearings are open to the public and input from interested parties will be accepted. Those unable to attend the public hearings are welcome to forward comments to OIR at ratehearings@floir.com. The subject line of emails should include the name of the company of interest and the words "rate hearings."
A list of past and upcoming rate hearings can be found on OIR's website here.
Average Homeowners' Policy Premium Data
OIR tracks the average homeowners' policy premium by county. A premium is the amount of money an insurance company charges for insurance coverage. The average premium by OIR is calculated by dividing direct written premium by policies in force.
Below is an overview of the statewide average homeowners' policy premium as of Q1 2024 (January 1 - March 31, 2024):
- Average Statewide Homeowners' Insurance Policy Premium (admitted market): $3,631.74
- Average Statewide Condo Unit Owners' Policy Premium (admitted market): $1,827.73
- Average Statewide Homeowners' Insurance Policy Premium (surplus lines): $8,285.06*
- Average Statewide Condo Unit Owners' Policy Premium (surplus lines): $3,134.72*
*OIR does not regulate rates for surplus line carriers.
Net Income and Net Underwriting Gain/Loss
OIR tracks the performance of Florida's domestic property insurers, including net underwriting gains, net income, and average combined ratio. Net Income represents the total revenues from an insurer's operations less total expenses and income taxes. Underwriting Gains or Losses represent how much an insurance company has either made or lost from their operations. The Average Combined Ratio is a measure of profitability which takes the sum of incurred losses and expenses and divides them by earned premium. Generally, an average combined ratio over 100 indicates that a company's profitability was negatively impacted by paying out more in expenses and losses compared to what was received from premium.
Performance of Florida Domestic Property Companies - Table
The table below displays information about the performance of Florida domestic property companies.
| Year | Net Income | Net Underwriting | Average Combined Ratio |
| 2006 | $220,531,044 | $218,919,835 | 89.4% |
| 2007 | $355,742,943 | $194,040,613 | 155.2% |
| 2008 | $37,364,190 | -$36,741,042 | 159.9% |
| 2009 | -$114,816,523 | -$618,995,868 | 156.6% |
| 2010 | $43,016,580 | -$270,168,818 | 212.3% |
| 2011 | $124,438,737 | -$119,678,073 | 54.7% |
| 2012 | $287,909,695 | $140,564,734 | 90.2% |
| 2013 | $677,547,215 | $704,257,383 | 81.7% |
| 2014 | $797,571,586 | $940,378,566 | 199.3% |
| 2015 | $829,724,943 | $876,072,136 | 75.1% |
| 2016 | $151,420,727 | -$34,743,000 | 110.0% |
| 2017 | -$82,894,498 | -$386,731,224 | 20.0% |
| 2018 | -$85,594,262 | -$350,594,219 | 114.3% |
| 2019 | -$49,513,197 | -$440,143,260 | 108.2% |
| 2020 | -$556,072,108 | -$1,358,267,842 | 251.8% |
| 2021 | -$555,160,634 | -$1,005,873,422 | 85.9% |
| 2022 | -$853,693,120 | -$1,258,488,369 | 349.2% |
| 2023 | $312,712,799 | -$78,151,224 | 104.9% |
| 2024 Q1 | $281,314,675 | $168,955,211 | 12.3% |
| 2024 Q2 | $482,670,365 | $230,752,364 | -2.0% |
Performance of Florida Domestic Property Companies - Chart
The chart below displays information about the performance of Florida domestic property companies. The orange bar depicts the domestic industry's underwriting gain or loss. The blue bar indicates the domestic industry's net income. The blue line indicates the average combined ratio.
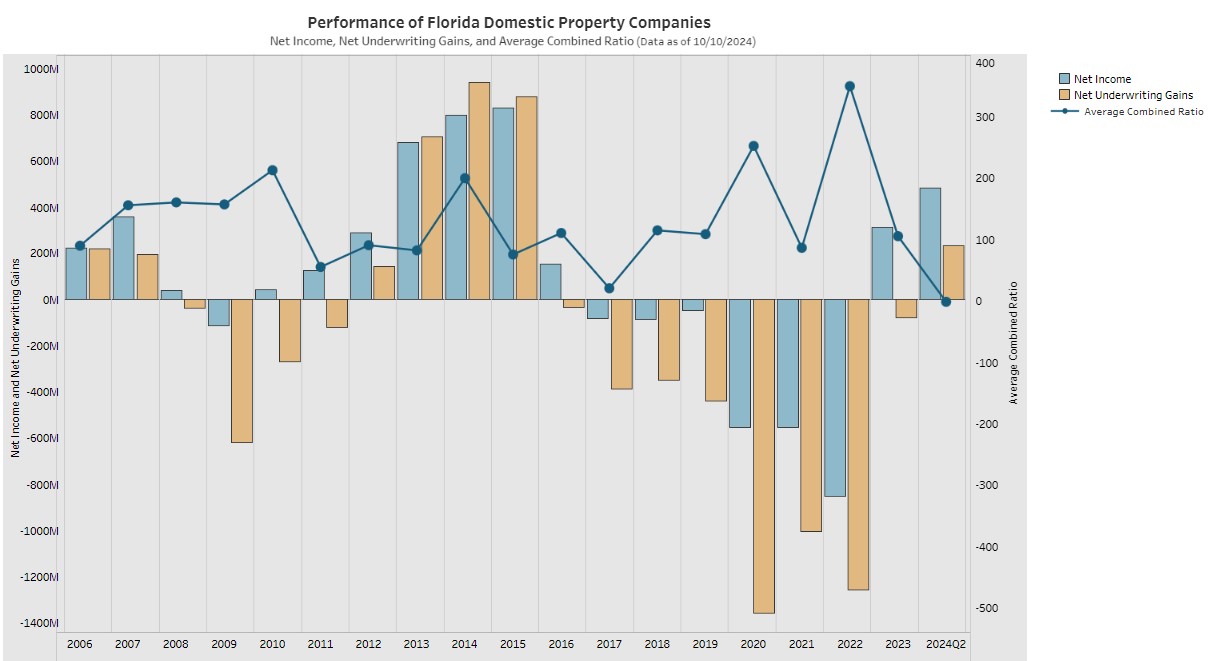 |
Data as of October 10, 2024. Data is from statutory financial statements submitted to the National Association of Insurance Commissioners. Citizens Property Insurance Corporation data is not included.
Loss Reserve Development
Insurers establish a loss reserve, which is the amount the insurer believes that claims will cost. At periodic points in time, an insurer goes back and evaluates how much those claims actually cost and uses that information to inform reserves going forward. If claims cost less than projected, reserve redundancies exist. If claims cost more than projected, reserves are said to have developed adversely.
If market trends result in increased claims payments of more than what was originally reserved, the actuary may recommend increasing the company’s reserves for future claims payments. To quantify, when carriers looked back one year later on their claims in 2022, claims were approximately $224 million more than estimated after one year, and $772 million at the two year mark. These numbers reflect the degree of uncertainty which exists in the property insurance market, which in turn impacts reinsurance capacity and reinsurance rates for insurers. The insurance industry is inherently uncertain; for this reason, it is not expected that the established loss reserve will always exactly equal the ultimate cost of claims.
The data in the table and chart below depicts loss reserve development for Florida domestic insurers. The data in the table and chart below is as of Q4 2023 (October 1 - December 31, 2023).
Loss Reserve Development Over Time - Table
| Year | One-Year Loss Reserve Development | Two-Year Loss Reserve Development |
| 2018 | $418,361,083 | $241,305,223 |
| 2019 | $422,383,887 | $682,716,189 |
| 2020 | $256,176,545 | $676,441,792 |
| 2021 | $480,695,579 | $336,997,842 |
| 2022 | $223,592,143 | $721,989,376 |
| 2023 | $160,885,675 | $398,721,036 |
Loss Reserve Development Over Time - Chart
For the chart below, the blue line shows the one-year loss reserve development, and the orange line shows the two-year loss reserve development.
 |
Data as of December 31, 2023. Data is from statutory financial statements submitted to the National Association of Insurance Commissioners and from Quarterly Supplemental Reporting. Citizens Property Insurance Corporation is included.
Authorized Insurer Financials
Pursuant to s. 624.315, F.S. OIR tracks the names of authorized insurers transacting insurance in this state, by requiring abstracts of their financial statements including assets, liabilities, and net worth. The documents below contain the Authorized Florida Insurer Financial Abstracts for calendar years 2019, 2020, 2021 and 2022, as required by s. 624.315, F.S.. The Authorized Florida Insurer Financial Abstracts contain information regarding net admitted assets, liabilities, capital and surplus, and direct premiums written in Florida.
Please note: Data represented in the Authorized Florida Insurer Financial Abstracts is submitted to OIR following the conclusion of the previous calendar year. Each report below is categorized by publishing year and the calendar year data contained within the report.
- 2023 Report - Calendar Year 2022
- 2022 Report - Calendar Year 2021
- 2021 Report - Calendar Year 2020
- 2020 Report - Calendar Year 2019
The Clams Life Cycle Report (Property Claims and Litigation Data Call)
Pursuant to s. 624.424(11), F.S., each authorized insurer or insurer group issuing personal lines or commercial lines residential property insurance policies in Florida is required to annually file a supplemental report on an individual and group basis for closed claims with OIR.
The Claims Life Cycle Report (Property Claims and Litigation Data Call) was designed to assist OIR and other stakeholders with identifying and understanding the life cycle of a claim and claims trends. The data reported captures information about closed claims during the previous calendar year. The data call is specific to Florida and tracks the entire life cycle of a claim. Collecting data related to the life cycle of a claim assists in detecting and resolving any emerging issues in the claims experience process. The data call is the first data collection across the country to require detailed closed claims experience from companies in this format. To ensure the integrity of the data, OIR identified irregularities and required insurers to resubmit corrected filings throughout the review process.
2024 Claims Life Cycle Report (Property Claims and Litigation Data Call)
In January 2024, OIR issued the 2024 Claims Life Cycle Reporting (Property Claims and Litigation Data Call) notice to each insurer or insurer group required to submit data. The data call was noticed to 629 companies and 187 companies submitted data filings. OIR issued the data call to all required insurers authorized to do business in the state. A company can be authorized to do business, but have no policies in force, and therefore have no data to submit. A "no data" filing allows OIR to track which companies have responded, but do not have data.
OIR received data for a total of 658,512 unique claims closed during calendar year 2023. An overview of the claims data reported is below:
- Total Number of Reported Claims Closed in 2023: 658,512
- Total Number of Litigated Claims: 64,351
- Total Number of Non-Litigated Claims: 541,211
- Non-Catastrophe Claims Reduced (-7.26%) from 2022 to 2023.
- Total Cost of Indemnity Paid for Claims Closed in 2023: $15.3 Billion
- Total Loss Adjustment Expenses (LAE) Paid for Claims Closed in 2023: $1.9 Billion
- Average LAE Paid Across All Perils for Litigated Claims: $10,543
- Average LAE Paid Across All Perils for Non-Litigated Claims: $2,011
Claims Closed During Calendar Year 2023
The 2024 Claims Life Cycle Report captures information about claims closed in 2023 by peril. The table below provides an overview of the closed claims data submitted for the 2024 Claims Life Cycle Report.
| Peril | Closed Claims | Litigated | Non-Litigated | Unknown |
| Accidental Discharge; Overflow of Water; Steam | 89,641 | 12.55% | 76.96% | 10.48% |
| All Other Perils | 96,111 | 6.46% | 83.38% | 10.16% |
| Falling Object | 3,370 | 7.33% | 87.95% | 4.72% |
| Fire or Lightning | 13,964 | 2.54% | 82.98% | 14.48% |
| Hurricane | 249,294 | 7.40% | 88.33% | 4.27% |
| Other Water | 69,797 | 13.25% | 81.25% | 5.50% |
| Sinkhole | 277 | 16.01% | 74.02% | 9.96% |
| Windstorm or Hailstorm (other than Hurricane) | 136,058 | 13.42% | 71.89% | 14.69% |
Litigated and Non-Litigated Closed Claims Comparison
Data reported by insurers can provide information about litigation practices throughout the state. The counties with the highest number of claims closed do not necessarily reflect higher numbers of litigated claims. The table below provides information on reported litigation practices.
| Area of the State | Policies in Force | Litigated Claims | Non-Litigated Claims | Percentage of Litigated Claims within Region |
| Palm Beach, Broward, Miami-Dade Counties | 1,660,339 | 27,960 | 75,231 | 25.94% |
| Seminole, Orange, Lake and Osceola Counties | 769,047 | 8,602 | 62,313 | 10.95% |
| All Other Counties | 5,023,074 | 27,789 | 403,667 | 5.85% |
| Statewide | 7,452,460 | 64,351 | 541,211 | 9.73% |
Combined View of Indemnity and LAE Paid for Litigated Claims
The total claim amount paid by an insurer includes the total of the indemnity paid and the total LAE paid. Indemnity is the compensation for loss. Loss Adjustment Expenses is the cost involved in an insurance company's adjustment of losses under a policy. The life of a claim begins when a claim is reported by a policyholder to an insurer. The time it takes for an insurer to close a claim varies depending on many factors, including whether or not a claim is litigated. The table below provides information on the cost of litigated claims by peril and by days to close.
| Peril | Days to Close | Avg. Indemnity Litigated | Avg. Indemnity Non-Litigated | Avg. LAE Litigated | Avg. LAE Non-Litigated |
| Accidental Discharge; Overflow of Water; Steam | <61 Days | $22,084 | $8,490 | $10,170 | $1,055 |
| Accidental Discharge; Overflow of Water; Steam | 61 - 180 Days | $27,409 | $17,803 | $11,854 | $1,831 |
| Accidental Discharge; Overflow of Water; Steam | 181 - 365 Days | $38,241 | $34,797 | $10,702 | $2,714 |
| Accidental Discharge; Overflow of Water; Steam | >365 Days | $51,335 | $48,140 | $17,765 | $5,932 |
| All Other Perils | <61 Days | $27,771 | $5,813 | $5,629 | $907 |
| All Other Perils | 61 - 180 Days | $34,034 | $18,016 | $6,579 | $2,599 |
| All Other Perils | 181 - 365 Days | $42,479 | $42,068 | $9,343 | $3,627 |
| All Other Perils | >365 Days | $58,279 | $63,632 | $16,038 | $9,776 |
| Falling Object | <61 Days | $21,738 | $3,572 | $12,546 | $793 |
| Falling Object | 61 - 180 Days | $18,964 | $13,043 | $14,447 | $1,945 |
| Falling Object | 181 - 365 Days | $28,532 | $31,488 | $12,474 | $2,214 |
| Falling Object | >365 Days | $63,826 | $33,317 | $23,595 | $3,180 |
| Fire or Lightning | <61 Days | $63,966 | $27,619 | $18,810 | $1,170 |
| Fire or Lightning | 61 - 180 Days | $121,368 | $86,460 | $11,496 | $2,996 |
| Fire or Lightning | 181 - 365 Days | $131,552 | $166,172 | $14,149 | $5,407 |
| Fire or Lightning | >365 Days | $226,604 | $265,301 | $28,408 | $9,811 |
| Hurricane | <61 Days | $52,975 | $23,291 | $10,670 | $2,156 |
| Hurricane | 61 - 180 Days | $52,017 | $34,986 | $12,725 | $3,127 |
| Hurricane | 181 - 365 Days | $66,600 | $55,788 | $12,892 | $4,638 |
| Hurricane | >365 Days | $90,376 | $114,898 | $21,470 | $8,514 |
| Other Water | <61 Days | $25,509 | $9,173 | $8,888 | $1,314 |
| Other Water | 61 - 180 Days | $30,387 | $20,207 | $9,139 | $2,713 |
| Other Water | 181 - 365 Days | $34,936 | $33,607 | $7,955 | $3,419 |
| Other Water | >365 Days | $45,209 | $60,814 | $14,515 | $5,485 |
| Sinkhole | <61 Days | $76,300 | $2,139 | $22,615 | $2,665 |
| Sinkhole | 61 - 180 Days | $95,079 | $8,713 | $28,491 | $8,024 |
| Sinkhole | 181 - 365 Days | $121,524 | $150,818 | $19,652 | $12,253 |
| Sinkhole | >365 Days | $101,496 | $241,847 | $30,924 | $31,855 |
| Windstorm or Hailstorm (other than Hurricane) | <61 Days | $33,953 | $14,164 | $7,996 | $947 |
| Windstorm or Hailstorm (other than Hurricane) | 61 - 180 Days | $36,196 | $24,604 | $9,962 | $2,365 |
| Windstorm or Hailstorm (other than Hurricane) | 181 - 365 Days | $41,790 | $43,878 | $9,206 | $3,023 |
| Windstorm or Hailstorm (other than Hurricane) | >365 Days | $52,858 | $40,898 | $13,825 | $7,647 |
2023 Claims Life Cycle Report (Property Claims and Litigation Data Call)
In January 2023, OIR issued the 2023 Claims Life Cycle Reporting (Property Claims and Litigation Data Call) notice to each insurer or insurer group required to submit data. The data call was noticed to 621 companies and 180 companies submitted data filings. OIR issued the reporting notice to all required insurers authorized to do business in the state. A company can be authorized to do business, but have no policies in force, and therefore have no data to submit. A "no data" filing allows OIR to track which companies have responded, but do not have data. The complete 2023 Claims Life Cycle Report is available here.
OIR received data for a total of 732,390 unique claims closed during calendar year 2022. An overview of the claims data reported is below:
- Total Number of Reported Claims Closed in 2022: 732,390
- Total Number of Litigated Claims: 58,395
- Total Number of Non-Litigated Claims: 534,738
- Total Cost of Indemnity Paid for Claims Closed in 2022: $11.2 Billion
- Total Loss Adjustment Expenses (LAE) Paid for Claims Closed in 2022: $1.5 Billion
- Average LAE Paid Across All Perils for Litigated Claims: $9,934
- Average LAE Paid Across All Perils for Non-Litigated Claims: $1,576
Claims Closed During Calendar Year 2022
The 2023 Claims Life Cycle Report captures information about claims closed in 2022 by peril. The table below provides an overview of the closed claims data submitted for the 2023 Claims Life Cycle Report.
| Peril | Closed Claims | Litigated | Non-Litigated | Unknown |
| Accidental Discharge; Overflow of Water; Steam | 84,890 | 11.61% | 70.47% | 17.92% |
| All Other Perils | 81,788 | 7.16% | 69.85% | 22.98% |
| Falling Object | 3,358 | 6.05% | 83.92% | 10.04% |
| Fire or Lightning | 15,287 | 1.91% | 73.76% | 24.33% |
| Hurricane | 291,155 | 5.08% | 77.09% | 17.84% |
| Other Water | 83,298 | 11.56% | 76.62% | 11.82% |
| Sinkhole | 319 | 20.38% | 65.20% | 14.42% |
| Windstorm or Hailstorm (other than Hurricane) | 172,295 | 10.29% | 66.92% | 22.79% |
Litigated and Non-Litigated Closed Claims Comparison
Data reported by insurers can provide information about litigation practices throughout the state. The counties with the highest number of claims closed do not necessarily reflect higher numbers of litigated claims. The table below provides information on reported litigation practices.
| Area of the State | Policies in Force | Litigated Claims | Non-Litigated Claims | Percentage of Litigated Claims within Region |
| Palm Beach, Broward, Miami-Dade Counties | 1,651,621 | 28,653 | 75,432 | 27.5% |
| Seminole, Orange, Lake and Osceola Counties | 846,647 | 7,171 | 65,612 | 9.9% |
| All Other Counties | 4,772,823 | 22,571 | 393,694 | 5.4% |
| Statewide | 7,271,091 | 58,395 | 534,738 | 9.8% |
Combined View of Indemnity and LAE Paid for Litigated Claims
The total claim amount paid by an insurer includes the total of the indemnity paid and the total LAE paid. Indemnity is the compensation for loss. Loss Adjustment Expenses is the cost involved in an insurance company's adjustment of losses under a policy. The life of a claim begins when a claim is reported by a policyholder to an insurer. The time it takes for an insurer to close a claim varies depending on many factors, including whether or not a claim is litigated. The table below provides information on the cost of litigated claims by peril and by days to close.
| Peril | Days to Close | Avg. Indemnity Litigated | Avg. Indemnity Non-Litigated | Avg. LAE Litigated | Avg. LAE Non-Litigated |
| Accidental Discharge; Overflow of Water; Steam | <61 Days | $26,535 | $9,038 | $10,108 | $1,131 |
| Accidental Discharge; Overflow of Water; Steam | 61 - 180 Days | $31,070 | $17,851 | $10,907 | $1,874 |
| Accidental Discharge; Overflow of Water; Steam | 181 - 365 Days | $38,785 | $31,816 | $9,757 | $2,911 |
| Accidental Discharge; Overflow of Water; Steam | >365 Days | $51,658 | $57,479 | $15,633 | $6,273 |
| All Other Perils | <61 Days | $29,221 | $4,867 | $8,655 | $808 |
| All Other Perils | 61 - 180 Days | $22,914 | $15,057 | $6,927 | $2,608 |
| All Other Perils | 181 - 365 Days | $31,474 | $23,594 | $8,607 | $3,422 |
| All Other Perils | >365 Days | $56,062 | $53,062 | $16,442 | $9,397 |
| Falling Object | <61 Days | $26,466 | $2,692 | $11,884 | $767 |
| Falling Object | 61 - 180 Days | $25,172 | $7,603 | $15,490 | $1,572 |
| Falling Object | 181 - 365 Days | $37,520 | $27,268 | $6,557 | $2,383 |
| Falling Object | >365 Days | $46,179 | $25,242 | $14,296 | $1,877 |
| Fire or Lightning | <61 Days | $79,219 | $18,144 | $12,588 | $912 |
| Fire or Lightning | 61 - 180 Days | $124,059 | $71,845 | $12,058 | $2,675 |
| Fire or Lightning | 181 - 365 Days | $194,499 | $161,600 | $15,622 | $6,053 |
| Fire or Lightning | >365 Days | $229,174 | $258,169 | $23,866 | $10,101 |
| Hurricane | <61 Days | $65,631 | $11,854 | $11,621 | $1,519 |
| Hurricane | 61 - 180 Days | $62,646 | $21,067 | $14,980 | $1,896 |
| Hurricane | 181 - 365 Days | $69,629 | $42,432 | $14,152 | $5,537 |
| Hurricane | >365 Days | $77,047 | $112,611 | $17,640 | $14,872 |
| Other Water | <61 Days | $20,449 | $7,595 | $7,500 | $1,178 |
| Other Water | 61 - 180 Days | $23,690 | $15,938 | $6,597 | $2,711 |
| Other Water | 181 - 365 Days | $29,812 | $28,807 | $5,949 | $3,461 |
| Other Water | >365 Days | $39,525 | $55,562 | $10,504 | $7,448 |
| Sinkhole | <61 Days | $417,047 | $2,409 | $43,327 | $6,944 |
| Sinkhole | 61 - 180 Days | $112,483 | $17,122 | $24,792 | $10,404 |
| Sinkhole | 181 - 365 Days | $106,224 | $96,440 | $26,530 | $11,759 |
| Sinkhole | >365 Days | $203,533 | $181,878 | $30,122 | $17,596 |
| Windstorm or Hailstorm (other than Hurricane) | <61 Days | $35,474 | $10,099 | $6,675 | $985 |
| Windstorm or Hailstorm (other than Hurricane) | 61 - 180 Days | $35,116 | $16,229 | $7,342 | $2,131 |
| Windstorm or Hailstorm (other than Hurricane) | 181 - 365 Days | $54,640 | $26,704 | $8,956 | $3,124 |
| Windstorm or Hailstorm (other than Hurricane) | >365 Days | $53,594 | $47,292 | $10,298 | $8,026 |
Florida Public Hurricane Loss Model
Florida leads the nation in a number of ways, including its longstanding focus on comprehensive efforts to protect the insurance market. This includes innovative insurer solutions of how to apply technology and innovation to the mitigation of storm, wildfire, other risks; evaluation of insurance product innovation directed at reducing, managing, and mitigating risk, as well as closing protection gaps; considering pre-disaster mitigation and resiliency as the role of state insurance regulators; and engaging with ongoing mitigation research and analysis.
One of the tools OIR uses to protect the insurance market is the Florida Public Hurricane Loss Model (FPHLM). The FPHLM is a hurricane catastrophe model developed by a multi-disciplinary team of experts in the fields of meteorology, wind and structural engineering, computer science, GIS, statistics, finance, and actuarial science.
The model consists of three major components: wind hazard (meteorology), vulnerability (engineering), and insured loss cost (actuarial). It has over a dozen sub-components. The computer platform is designed to accommodate future hookups of additional sub-components or enhancements.
The FPHLM estimates loss costs and probable maximum loss levels from hurricane events for personal lines and commercial lines of residential property. The losses are estimated for building, appurtenant structure, contents, and additional living expenses.
Annual Reinsurance Data Call
Florida is the most catastrophe-prone region in the United States with 8,436 miles of shoreline. To spread that catastrophic risk outside of Florida's borders, insurers turn to the global reinsurance market. Reinsurance, at its most basic level, is insurance for insurance companies. Insurers rely on reinsurance to finance the payment of losses and make them better able to withstand major catastrophes, like hurricanes.
Reinsurance is a major driver in the cost of insurance and Florida's domestic property insurance industry is especially reliant on reinsurance to finance the payment of catastrophe losses and is sensitive to hardening reinsurance market conditions. For instance, as much as 40% of the premium a consumer pays goes to purchase reinsurance. When the supply of reinsurance is readily available and affordable, the capacity of domestic property insurers to write and retain business is enhanced, and the premium impact to consumers is modest.
OIR conducts the Annual Reinsurance Data Call (ARDC) to assess insurers' financial viability in covering catastrophic losses with respect to their catastrophic reinsurance programs. The ARDC consists of four stages:
- Stage 1 - Collect estimate of what insurers plan to purchase for reinsurance.
- Stage 2 - Collect the actual amount of reinsurance purchased by insurers.
- Stage 3 - Collect information on the reinsurers utilized.
- Stage 4 - Collect information on the reinsurance contracts.
Based on findings from the ARDC, the year over year risk-adjusted change in reinsurance costs has decreased. More information is below:
- In 2023, companies reported the risk-adjusted change in reinsurance cost from 2022 was on average +27%. Prior to the 2022 legislative reforms, increases averaged as high as +60%.
- In preparation for the 2024 reinsurance season, OIR met with Bermuda and New York based reinsures to provide an update on the state of the market, highlighting positive data points.
- Preliminary results of the 2024 ARDC signify reinsurance remains costly with early signs indicating price stabilization after a three-year run of increased prices.
- Preliminary results for the 2024 ARDC risk-adjusted change in reinsurance cost from 2023 indicates on average -1.7%, the first decrease in years.
- Florida Hurricane Catastrophe Fund rates, approved by the Florida Cabinet in June 2024, decreased for participating insurers by a statewide average of -8.25%. These rate decreases are, in part, based on modeled loss cost indications, even while exposure grows.
Catastrophe Stress Test
OIR is the only state in the nation to conduct a Catastrophe Stress Test (CST). The CST is an annual to evaluation of the reinsurance programs that companies have in place to respond to catastrophic events that may occur during the Atlantic hurricane season. OIR requires domestic property insurers, commercially domiciled insurers, and other selected companies to model their losses for the CST assuming a historical event or series of events occur. Through the CST, insurers are required to model a historical storm scenario, or a series of historical storm scenarios, and apply their purchased reinsurance program to the associated modeled loss.
The results of the CST are used by OIR to estimate the insurer’s surplus amounts after the simulated event and assist in determining if each insurer would continue to meet its minimum surplus requirement after each storm scenario. The 2024 CST scenarios are below:
- Scenario 1 - 1945 Homestead Hurricane, then 2004 Hurricane Charley, then 2004 Hurricane Frances
- Scenario 2 - 1921 Tampa Bay Hurricane, then 2017 Hurricane Irma, then 2018 Hurricane Michael
- Scenario 3 - 1928 Lake Okeechobee Hurricane, then 2005 Hurricane Wilma, then 2016 Hurricane Hermine
2023 CST Scenarios and Results
For the 2023 Hurricane Season, the CST was required to be submitted by domestic property insurers, commercially domiciled insurers, and other selected companies. The 2023 CST storm scenarios were:
- Scenario 1 - 1947 Fort Lauderdale Hurricane
- Scenario 2 - 2004 Hurricane Frances, followed by 2017 Hurricane Irma
- Scenario 3 - 1992 Hurricane Andrew, followed by 2018 Hurricane Michael
Based on the results of the CST scenarios, three insurers were projected to fall below the minimum surplus requirement. One insurer’s parent company committed to infusing more capital should the insurer’s surplus fall below the minimum requirement following an event. One insurer merged with and into an affiliate with a projected timeline of year-end 2023. The third insurer reported a surplus above the minimum requirement and its reinsurance program was not significantly impacted by the 2023 hurricane season.
Scenario 1: 1947 Fort Lauderdale Hurricane
Based on modeling information provided by insurers, the Fort Lauderdale Hurricane (1947) would have caused approximately $22.0 billion in insured losses during the 2023 Atlantic Hurricane Season. After recognizing the impact of reinsurance, net losses to insurers are projected to be reduced to approximately $5.6 billion.
Scenario 2: Hurricane Frances (2004) and Hurricane Irma (2017)
Based on modeling information provided by insurers, Hurricane Frances (2004) and Hurricane Irma (2017) would have caused approximately $17.8 billion in insured losses during the 2023 Atlantic Hurricane Season. After recognizing the impact of reinsurance, net losses to insurers are projected to be reduced to approximately $6.4 billion.
Scenario 3: Hurricane Andrew (1992) and Hurricane Michael (2018)
Based on modeling information provided by insurers, Hurricane Andrew (1992) and Hurricane Michael (2018) would have caused approximately $29.5 billion in insured losses during the 2023 Atlantic Hurricane Season. After recognizing the impact of reinsurance, net losses to insurers are projected to be reduced to approximately $7.3 billion.
2022 CST Scenarios and Results
For the 2022 Hurricane Season, the CST was required to be submitted by domestic property insurers, commercially domiciled insurers, and other selected companies. The 2022 CST storm scenarios were:
- Scenario 1 - 1928 Lake Okeechobee Hurricane
- Scenario 2 - 1921 Tampa Bay Hurricane, followed by 2004 Hurricane Frances
- Scenario 3 - 1960 Hurricane Donna, followed by 2004 Hurricane Jeanne
Based on the results of the CST scenarios, only one insurer was projected to fall below the minimum surplus requirement. The insurer’s parent company committed to infusing more capital should the insurer’s surplus fall below the minimum surplus requirement following an event.
Scenario 1: 1928 Lake Okeechobee Hurricane
Based on modeling information provided by insurers, the Lake Okeechobee Hurricane (1928) would have caused approximately $37.5 billion in insured losses during the 2022 Atlantic Hurricane Season. After recognizing the impact of reinsurance, net losses to insurer were projected to be reduced to approximately $4.5 billion.
Scenario 2: Tampa Bay Hurricane (1921) and Hurricane Frances (2004)
Based on modeling information provided by insurers, the Tampa Bay Hurricane (1921) and Hurricane Frances (2004) would have caused approximately $15.3 billion in insured losses during the 2022 Atlantic Hurricane Season. After recognizing the impact of reinsurance, net losses to insurer were projected to be reduced to approximately $4.5 billion.
Scenario 3: Hurricane Donna (1960) and Hurricane Jeanne (2004)
Based on modeling information provided by insurers, Hurricane Donna (1960) and Hurricane Jeanne (2004) would have caused approximately $25.7 billion in insured losses during the 2022 Atlantic Hurricane Season. After recognizing the impact of reinsurance, net losses to insurer were projected to be reduced to approximately $5.2 billion.
Citizens Property Insurance Corporation Proposed Rate Level Effect - 2025
The proposed 2025 Citizens Rate Filings listed below can be accessed via the IRFS Forms & Rates Filing Search system by searching the file log number or by entering "Citizens" as the "company name" in the "Quick Search" tab. Additional information regarding the proposed 2025 Citizens Rate Filings is available in the Citizens 2025 Rate Media Kit here.
| File Log # | Overall Proposed Change | Account | Proposed Rate Level Effect by Territory and County |
| 24-030310 | +13.5% | Homeowners Multi-Peril (PLA) | HO-3, HO-4, HO-6 (PLA) |
| 24-030311 | +14.4% | Homeowners Multi-Peril (CA) | HO-3, HO-4, HO-6 (CA) |
| 24-030441 | +13.9% | Property/Personal (Dwelling Fire) (PLA) | DP-1, DP-3 (PLA) |
| 24-030444 | +17.2% | Property/Personal (Dwelling Fire) Wind Only (CA) | DW-3 (CA) |
| 24-031016 | +22.1% | Mobile Homeowners Multi-Peril (PLA) | MHO-3, MHO-4 (PLA) |
| 24-031018 | +26.6% | Mobile Homeowners Multi-Peril (CA) | MHO-3 (CA) |
| 24-031814 | +19.0% | Mobile Homeowners Physical Damage (PLA) | MHO-Dwelling (PLA) |
| 24-031855 | +19.7% | Mobile Homeowners Physical Damage Wind Only (CA) | MHO-Dwelling (CA) |
| 24-037241 | +12.0% | Commercial Residential Multi-Peril Condo Assn. (CLA) | CRM Condo (CLA) |
| 24-037237 | +11.5% | Commercial Residential Multi-Peril Excluding Condo Assn. (CLA) | CRM Non-Condo (CLA) |
| 24-037430 | +0.0% | Commercial Non-Residential Multi-Peril (CLA) | CNRM (CA) |
| 24-037523 | +12.2% | Commercial Residential Wind Only Excluding Condo (CA) | CRW Non-Condo (CA) |
| 24-037522 | +12.4% | Commercial Residential Wind Only Condo Assn. (CA) | CRW Condo (CA) |
| 24-037525 | +0.4% | Commercial Non-Residential Wind Only (CA) | CNRW (CA) |
Citizens Property Insurance Corporation - 2024 Public Rate Hearing
OIR conducts an annual public rate hearing for proposed Citizens Property Insurance Corporation rate filings to hear testimony from the company and receive public comment. These hearings are open to the public and input from interested parties will be accepted. Those unable to attend the public hearings are welcome to forward comments to OIR by emailing ratehearings@floir.com with the subject line "Citizens Property Insurance Corporation." Please note, under Florida law, written communications to OIR are public record and subject to disclosure, including being available to the public and media.
Details for the 2024 Citizens Property Insurance Corporation Public Rate Hearing are below:
| When | Where | General Subject Matter to be Considered | Additional Materials |
August 1, 2024 1 p.m. | 412K Knott Building, Tallahassee, FL 32399 Click here to register and participate online. By Phone: 1-877-568-4108; Access Code: 768-800-634 | Citizens Property Insurance Corporation has requested statewide average rate change for its business in the Coastal Account ("CA"), Commercial Lines ("CLA"), and Personal Lines Account ("PLA"). |
Information for previous Citizens Property Insurance Corporation rate hearings are below:
Citizens Property Insurance Corporation Depopulation/Takeout Program
Takeout, or depopulation, is the program created by the Florida Legislature that was developed to reduce the number of Citizens’ insured properties and exposure. The program, created by section 627.351(6)(q), F.S., allows new and existing insurance companies to assume policies currently covered by Citizens in an attempt to transfer policies back to the private insurance market.
To assume policies from Citizens, private-market insurance companies must submit documentation to OIR verifying they meet OIR standards and have the financial resources and business plan in place to properly pay claims. If approved, OIR will issue a consent order indicating the number of policies eligible for removal, the assumption date and any additional stipulations.
As the property market continues to stabilize, OIR is seeing a continued interest from authorized insurers in the Citizens Depopulation program. OIR's Takeout Assumption Summaries, Takeout Company Approvals, and Requirements to Participate in the Takeout Program is available on OIR's website here.
The table below information about companies approved for the takeout program, number of policies approved for assumption, number of policies removed from Citizens, and the total reduced Citizens exposure from 2019 - 2024.
| Year | Total Companies Approved for Takeout | Total Policies Approved for Assumption | Total Policies Removed from Citizens** | Reduced Citizens Exposure** |
| 2024* | 18 | 1,263,749 | 371,295 | $170,384,224,633 |
| 2023 | 12 | 646,617 | 275,324 | $113,375,478,857 |
| 2022 | 4 | 80,201 | 16,408 | $7,173,925,259 |
| 2021 | 1 | 17,208 | 2,814 | $1,027,251,879 |
| 2020 | 4 | 87,288 | 7,463 | $2,497,401,410 |
| 2019 | 4 | 145,102 | 10,084 | $2,180,766,592 |
*Calendar Year 2024 data as of 9/05/2024.
**Data provided from Citizens Depopulation Resources page. Data as of 10/29/2024.
.png?sfvrsn=43e08f32_0 "Section Header_Fort")
Data Reporting & Collection
OIR collects data from insurers and regulated entities in accordance with Florida Statues. A full list of required data reporting is available on OIR's website here. A list of required data call reporting specific to property and casualty insurers is below:
- Temporary Discontinuance of Writing New Residential Property Insurance Policies - In accordance with Section 624.4301, Florida Statutes, and Rule 69O-137.014, Florida Administrative Code, any authorized insurer, before temporarily suspending writing new residential property insurance policies in Florida, must give notice to OIR.
- Commercial and Personal Residential Property Supplemental Quarterly Report - In accordance with section 624.424(10), Florida Statutes, insurers are required to report QUASR data to OIR on a quarterly basis.
- Catastrophe Claims Reporting - In accordance with section 624.307, Florida Statutes, OIR can institute a data call for the purpose of collecting additional claims and other relevant information from insurers related to a natural disaster causing catastrophic damage in Florida.
- P&C Calendar Year Experience Reporting - In accordance with section 627.915(2) and 627.915(5), Florida Statutes, companies are required to report PCCY Experience Reporting data to OIR on an annual basis. For PCCY Experience Reporting, insurers provide information on: Direct Premiums Written; Direct Premiums Earned; Loss Reserves for All Known Claims; Reserves for Losses Incurred but not Reported; Allocated Loss Adjustment Expense; Unallocated Loss Adjustment Expense; Direct Losses Paid; Underwriting Income or Loss; Commissions and Brokerage Fees; Taxes, Licenses and Fees; Other Acquisition Costs; General Expenses; Policyholder Dividends; Net Investment Gain or Loss.
- Residential Property Claims Litigation Reporting - In accordance with s. 624.424(11), F.S., companies are required to report personal and commercial residential property claims litigation data to OIR on an annual basis. This data call details the closed claim experience for the previous calendar year.
Historic Legislative Reform
Florida has enacted historic and unprecedented reforms designed to promote market stability. OIR closely tracks the impact of legislation on Florida's property insurance market. As we begin to see the impacts from these reforms, OIR remains committed to working alongside Governor DeSantis, the Florida Cabinet and the Florida Legislature to promote a stable and competitive insurance market for consumers.
For a full overview of insurance legislation passed by the Florida Legislature, please see OIR's Legislative Summaries here. Recent legislative reforms for Florida's property insurance market include:
- 2024: HB 1611 (Insurance), HB 1049 (Flood Disclosure in the Sale of Real Property), SB 7028 (My Safe Florida Home Program), HB 1029 (My Safe Florida Home Condominium Pilot Program)
- 2023: HB 799 (Property Insurance), HB 881 (My Safe Florida Home Program), HB 1185 (Consumer Protection), HB 837 (Civil Remedies), SB 7052 (Insurer Accountability)
- 2022: SB 2A (Dec. 2022 Special Session), SB 2D (May 2022 Special Session), SB 4D (May 2022 Special Session)
- 2021: SB 76 (Property Insurance), SB 1598 (Consumer Protection)
- 2020: HB 529 (Insurance Guaranty Associations)
- 2019: HB 7065 (Insurance Assignment Agreements)
Following these historic legislative reforms to strengthen Florida’s insurance market, OIR has approved nine additional property & casualty insurers to enter Florida’s market. Recently approved companies:
Trident Risk Managers
Ovation Home Insurance Exchange
Manatee Insurance Exchange
Condo Owners Reciprocal Exchange
Orange Insurance Exchange
Orion180 Select Insurance Company
Orion180 Insurance Company
Mainsail Insurance Company
Tailrow Insurance Company
.png?sfvrsn=814df3cc_0 "Section Header_Keys")